Components: Grafana
Description: Grafana is unique open platform for analytics and monitoring.
Provision script (Puppet manifest): grafana.pp
Additional info: Grafana site
The most opaque thing in IT it’s distributed system - you will not see what happens under hood until it’s too late. Of course if you don’t use some kind of monitoring and alarms - and I do…
Grafana can visualise data from a lot of sources (in my case it’s only InfluxDB) and makes it perfectly!
Here is some examples from my project:
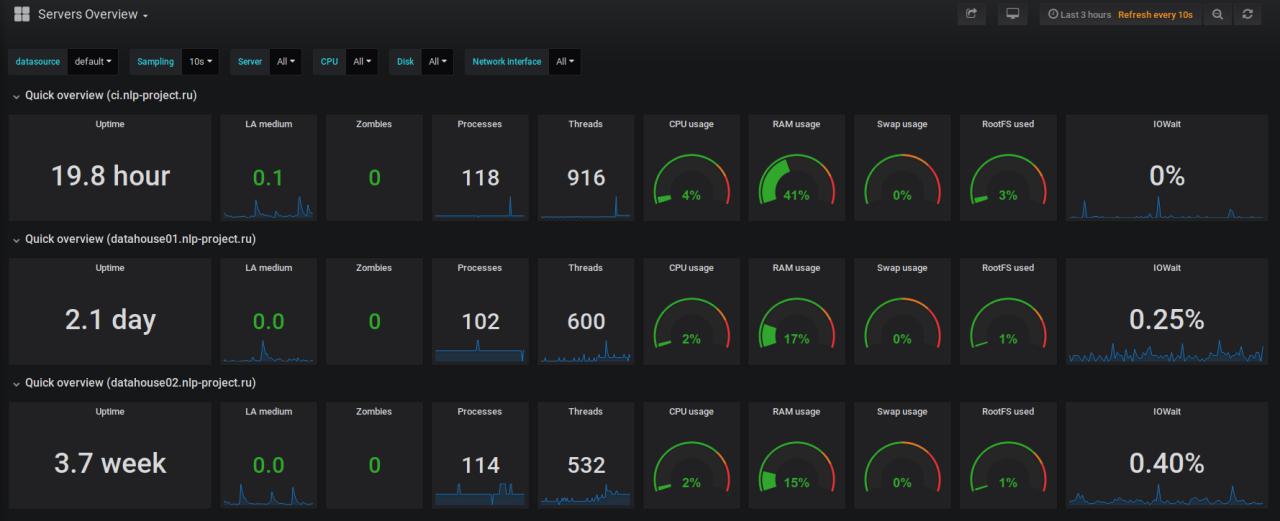
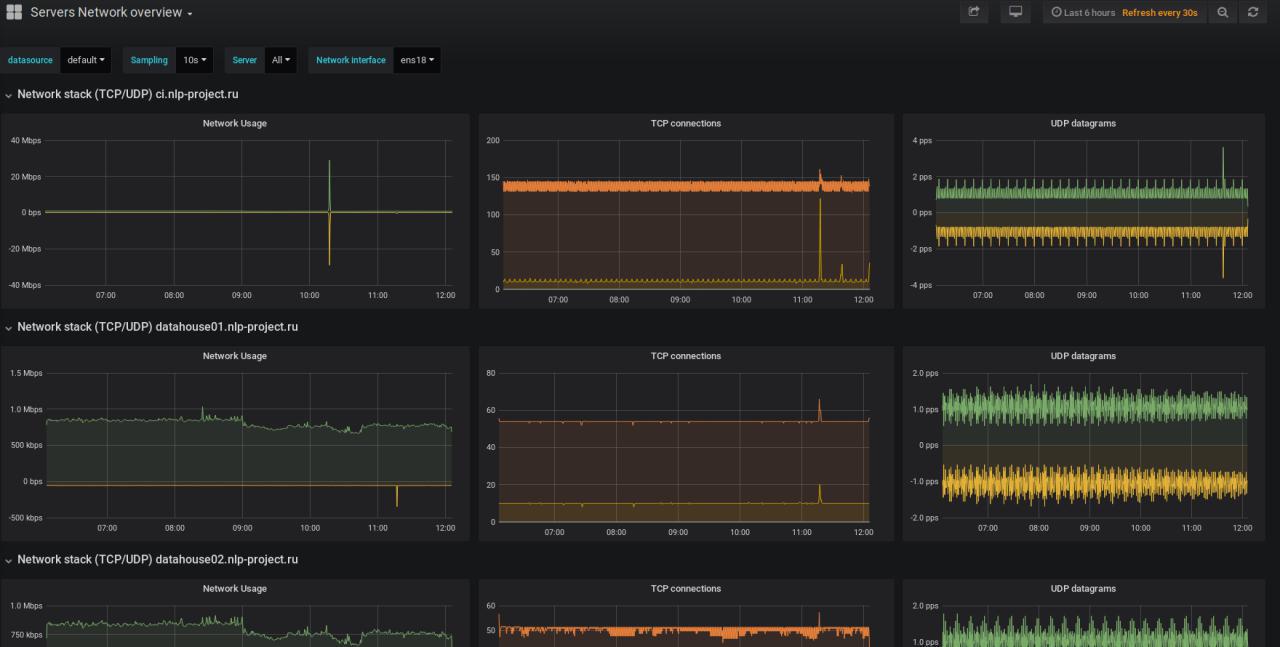
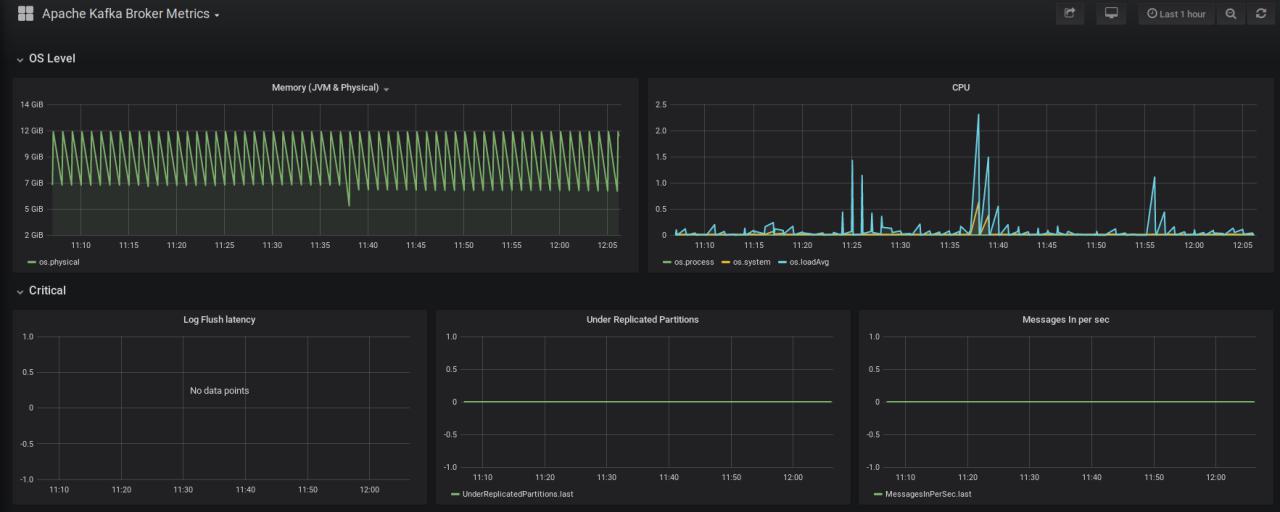
Another important part of its functionality - it’s ability to create alarms on some thresholds/events.
Table of content:
- Home
- Prerequisites
- Developement stand provisioning
- Components
- Crawler (Spring Boot, Java)
- Message Broker (Kafka)
- Distributed file storage (Hadoop’s HDFS)
- Data warehouse (Apache Hive)
- Distributed business logic cluster (Akka, Scala)
- Distributed data processing cluster (Spark, Scala)
- Indexing/Search engine (Elasticsearch)
- REST server (Lagom, Scala)
- Service coordination (Zookeeper)
- Time-series database (monitoring data) (InfluxDB)
- Metrics collector (Telegraf)
- Monitoring visualization service (Grafana)
- Reverse proxy/load-balancer (nginx)
- Monitoring Links
- Development